Debugging in Node.js (in 2017)
Debugging our applications is a critical part of the development process and can aid in discovering why the app may be behaving differently than expected. Doing this using Node.js can tend to be quite elusive and maybe even frustrating. In this post we’ll talk about the typical hurdles developers run into while debugging Node.js and look at better ways to approach it. We’ll go over the various techniques and tools that are available to help make debugging Node.js an easy task.
You can use this GitHub repository to follow along and try out what’s described in this post.
The Simple and Initial Approach: Console.log()
When starting out in a Node.js project for the first time the natural approach to debugging an application is with console.log. This is typical for developers either starting out in general for the first time or even seasoned developers coming from other languages and platforms. We want to get a quick understanding of what the value of a variable may be at a certain point in code or make sure a method is actually being executed. Plugging in a simple console.log(variable); or console.log('Made it here!!!'); and then spinning up our application is very simple and provides quick feedback. Let’s briefly take a look at an example of doing this in Node.js.
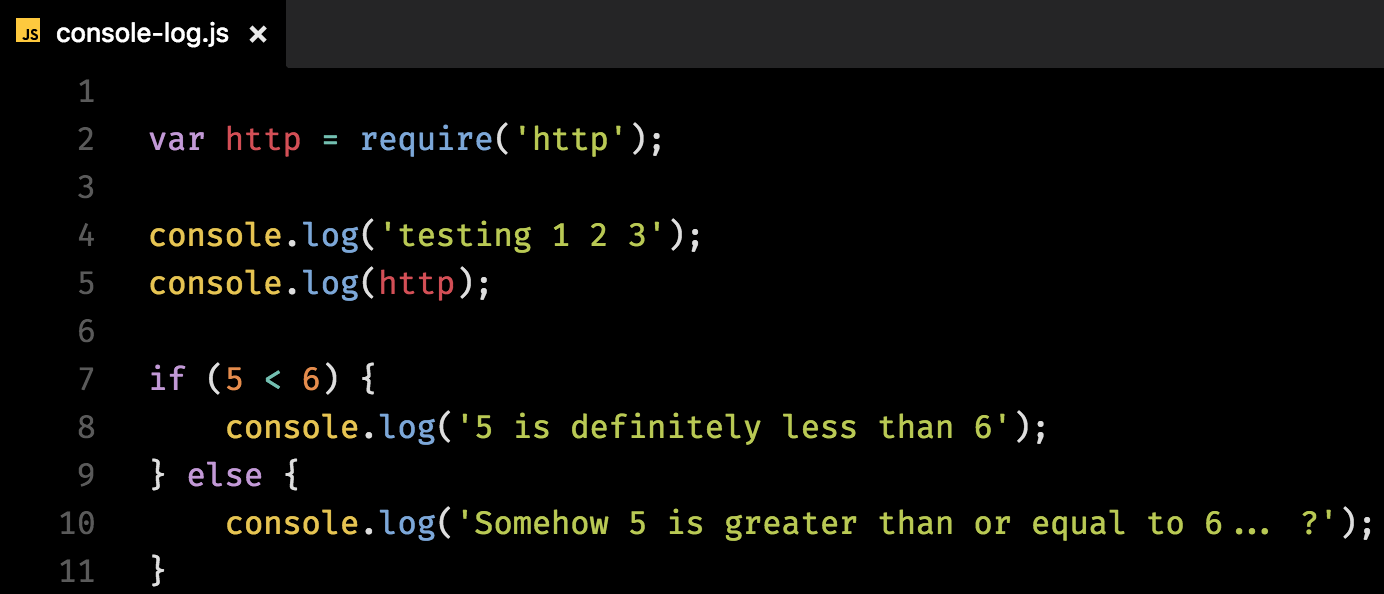
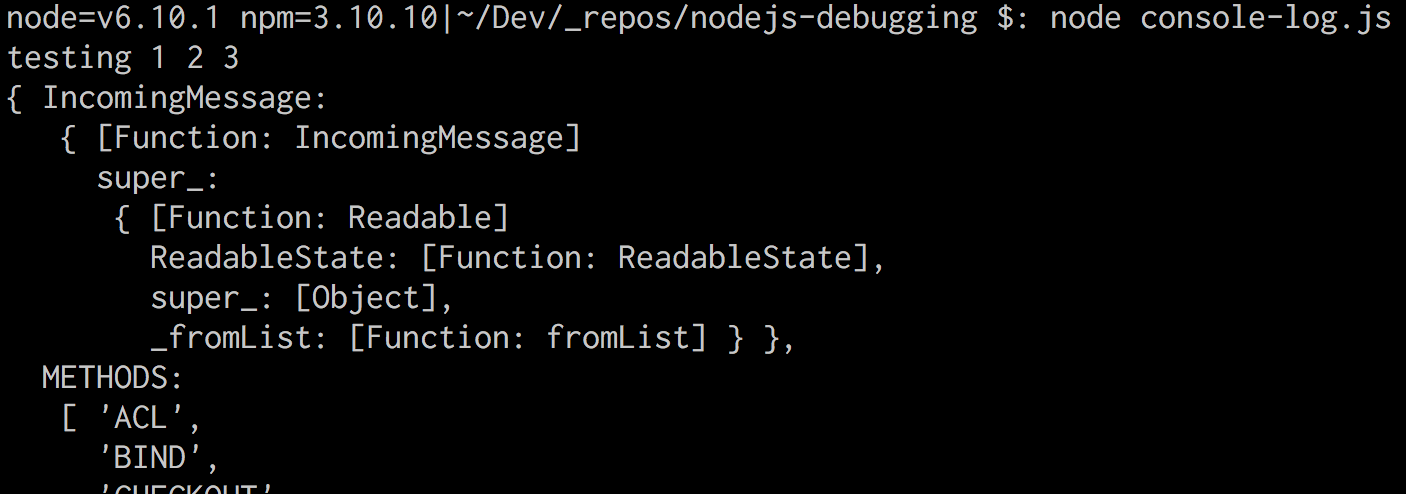
Here we can see that using the first log lets us know that Node.js executed this file so that we’ll see the message “testing 1 2 3” in our terminal window. After that we log the http variable so that we can inspect the value of it and see what other properties it may have. Lastly we use console.log to determine which branch of the if statement was executed and we’ll be able to determine this when we see what string message is in the terminal output.
This is useful to us in a very simple example and can still be useful in a more complex and robust Node.js application. However, as our applications grow this approach can be very tedious and become quite cumbersome to keep up with. If we really think about it we’d be adding these log statements throughout the stack we are trying to debug which could be lengthy depending on the size of the application. The other downside to this approach is that many times these logs which are supposed to be just for temporary debugging purposes will often be forgotten and left in our production code for which they were never intended.
Node.js Built-in Debugger
This brings us to the next feasible option to help with debugging: the built-in Node.js debugger. As is expected of a fully fledged platform, Node.js provides a debug target that runs as a separate process from an application.
Just like the console.log approach there’s no need to install anything on top of Node.js. The difference in using this approach is in the way we start our application. This is accomplished through a flag, debug or --debug, that let’s Node.js know to start up a separate debugger process.
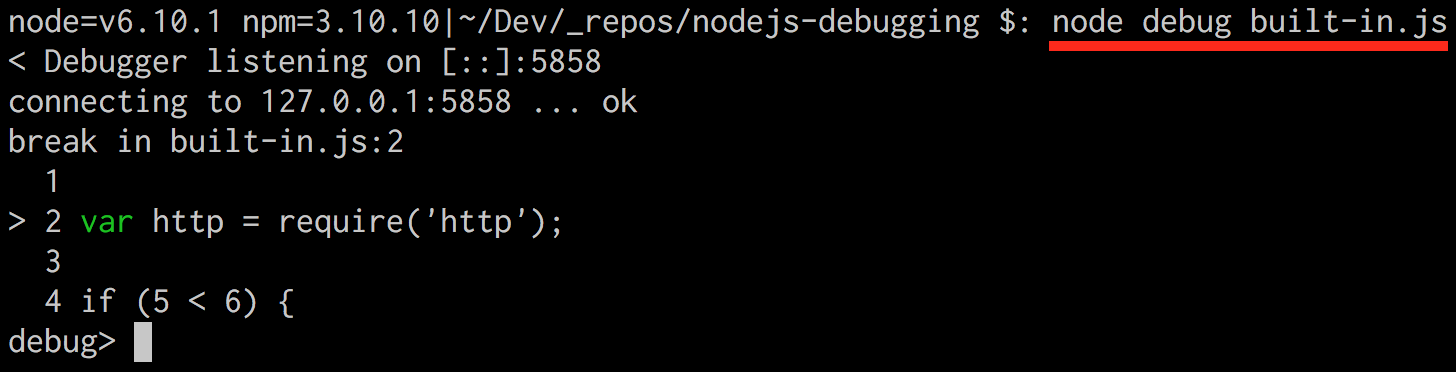
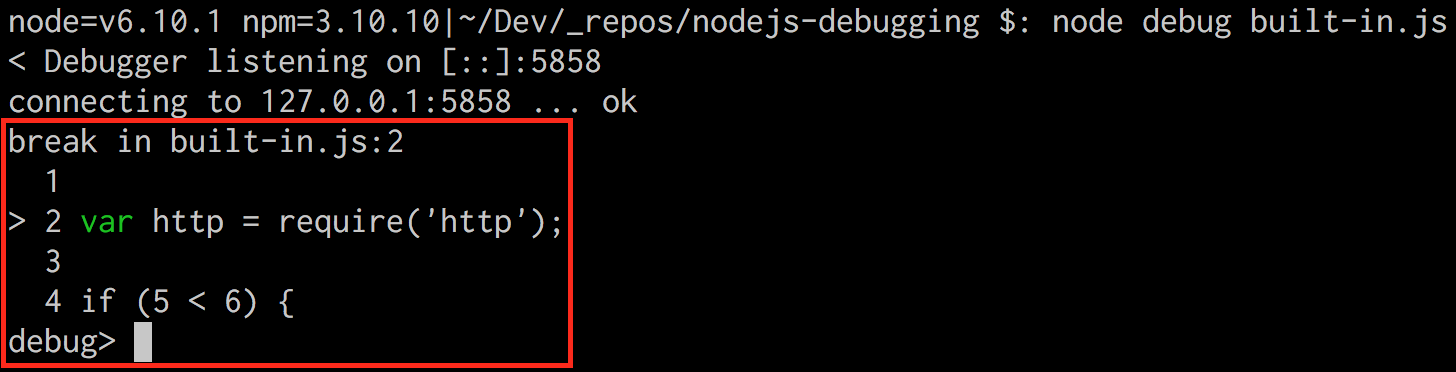
This debugger process will run in a self hosted instance on our machine under localhost and prompt us for further command. In the following example we can see it started up on port 5858.
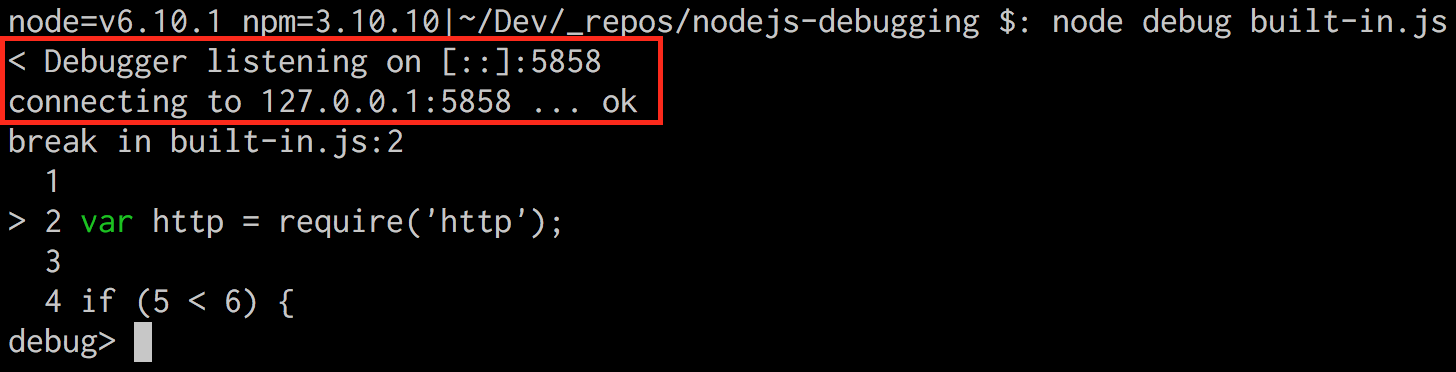
The > on line 2 indicates where the debugger has stopped in our code. The debug> is where we can enter our commands for the debugger to interpret and execute.
At this point there are many options for the commands we can send to the debugger that allow us to debug our code. Below are just a few core commands that will be useful as we go further through this example.
Navigation
- c: continue
- n: next
- s: step in
- o: step out
Breakpoints
- sb: set breakpoint
Watching
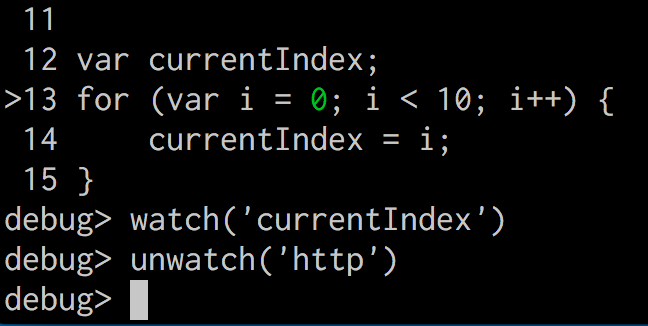
- watch(‘<variable name>’): adds a watch for the variable name indicated inside the string
- watchers: view all watchers and their values based on the current state
- unwatch(‘<variable name>’): removes the watch for the variable name indicated inside the string
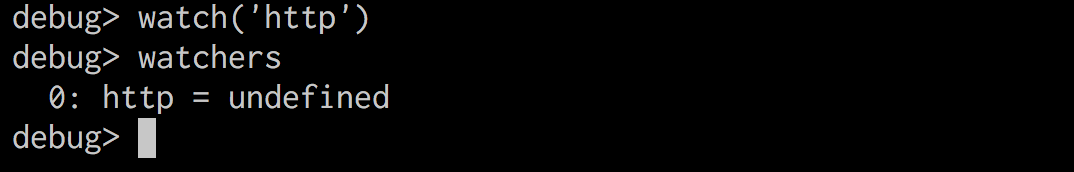
Let’s try to obtain the same value we found when using the console.log approach, but with the built-in debugger now. We’ll first add a watcher for the http variable and see what its value is in the application’s current state.
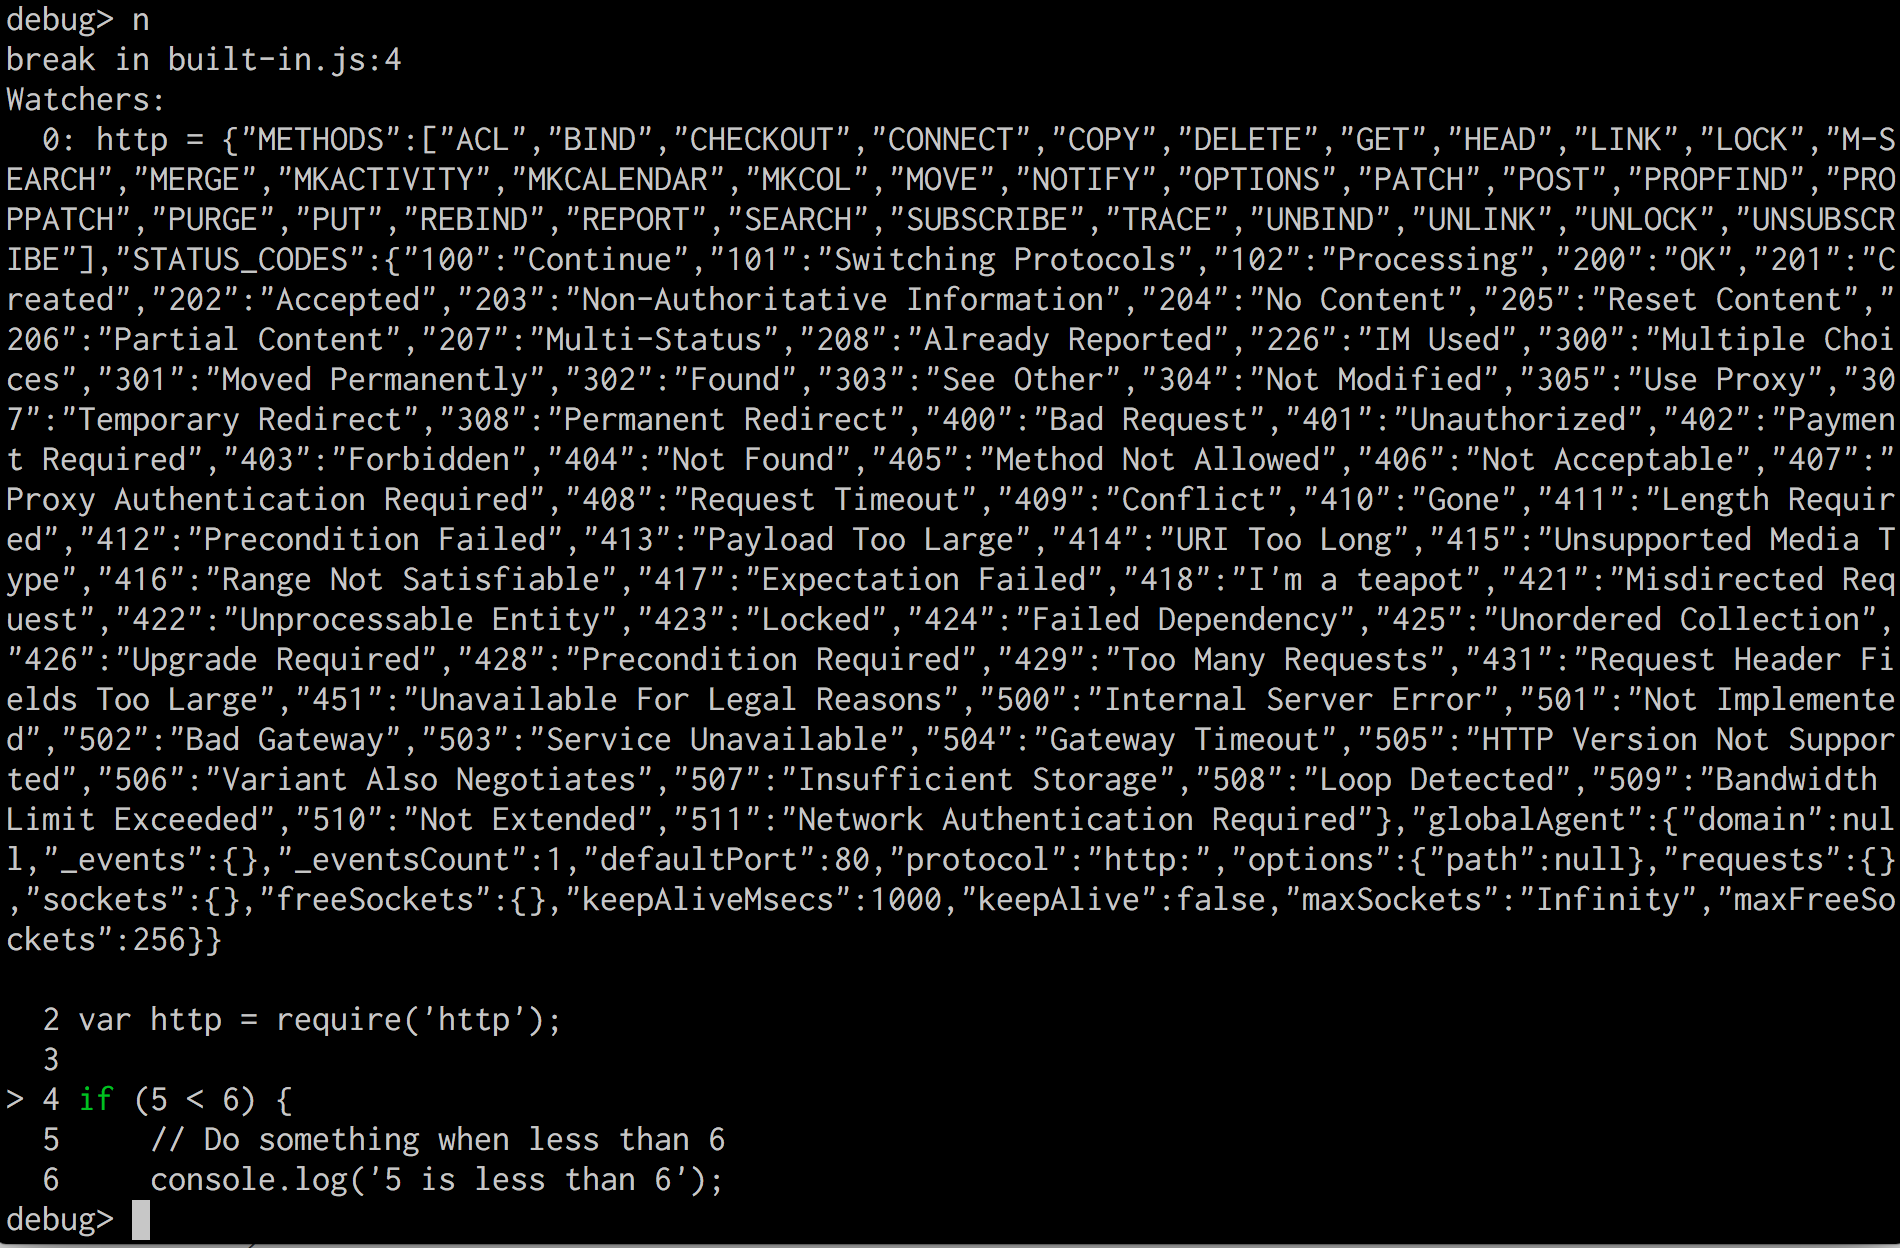
Now if we navigate to the next statement using the n command we’ll allow the process to go to the next statement in our program. This will result in the cursor stopping at the next statement and showing our place in the code which is our if statement. It will also display the change in value to our watched variable http.
We intentionally have the console.log statements in each condition of our if statement for demonstration purposes so that the debugger will have code to break on. Sending the next command again will bring us to the log statement with the message 5 is less than 6. We’ll send the next command again to stop the debugger at the code where we have a for loop. Let’s add a watcher on the currentIndex variable so we can keep track of its value. We’ll also unwatch the http variable so we can focus on just the currentIndex.
Sending the next command two times will bring us to line 14 where the currentIndex variable is assigned the value of the loop variable i. Once there we can send the next command one more time and see that the currentIndex variable’s value has now changed to 0.
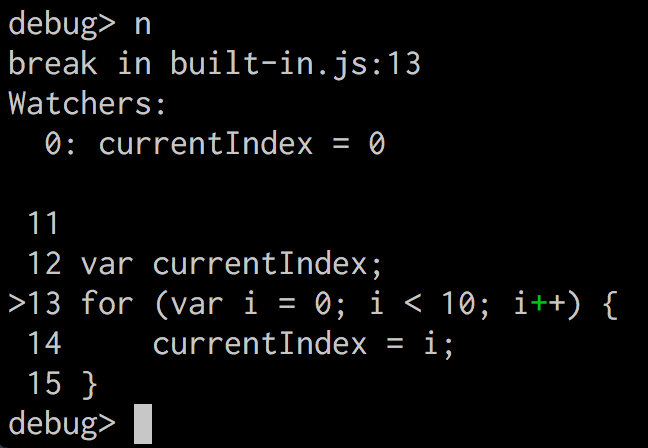
We can continue from here by stepping through the loop and observing the value changes of our watched variable after each iteration. The use of the built-in debugger is pretty helpful and a step up from the console log method because we can control the flow of code execution. This also creates a better debugging workflow in that we don’t have to restart our app every time we add or remove more console logs to help us debug further. While this is great, it would be even better if we had some type of UI that can make debugging even easier.
Node.js Built-in Inspector
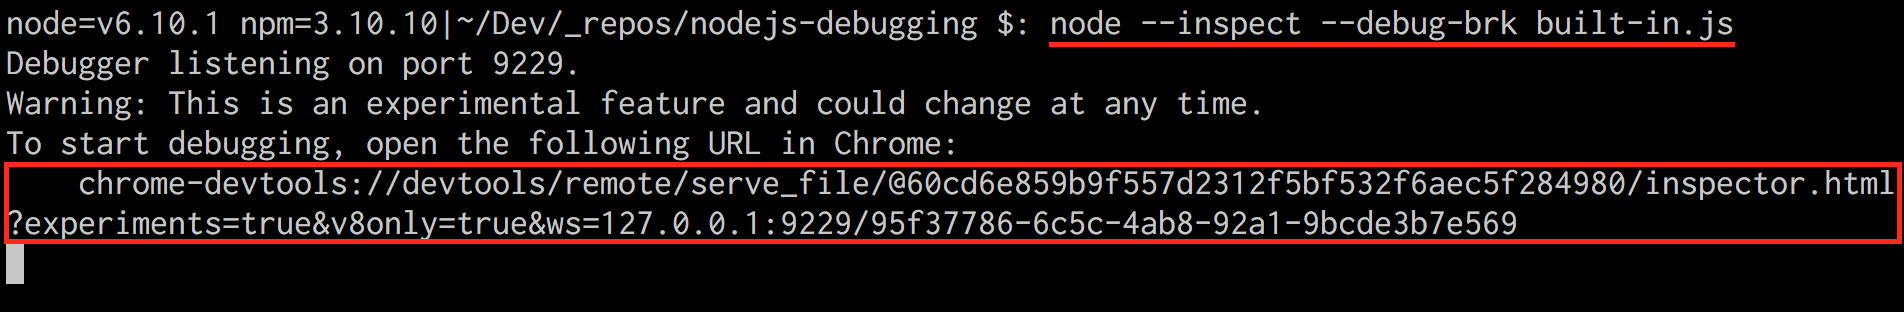
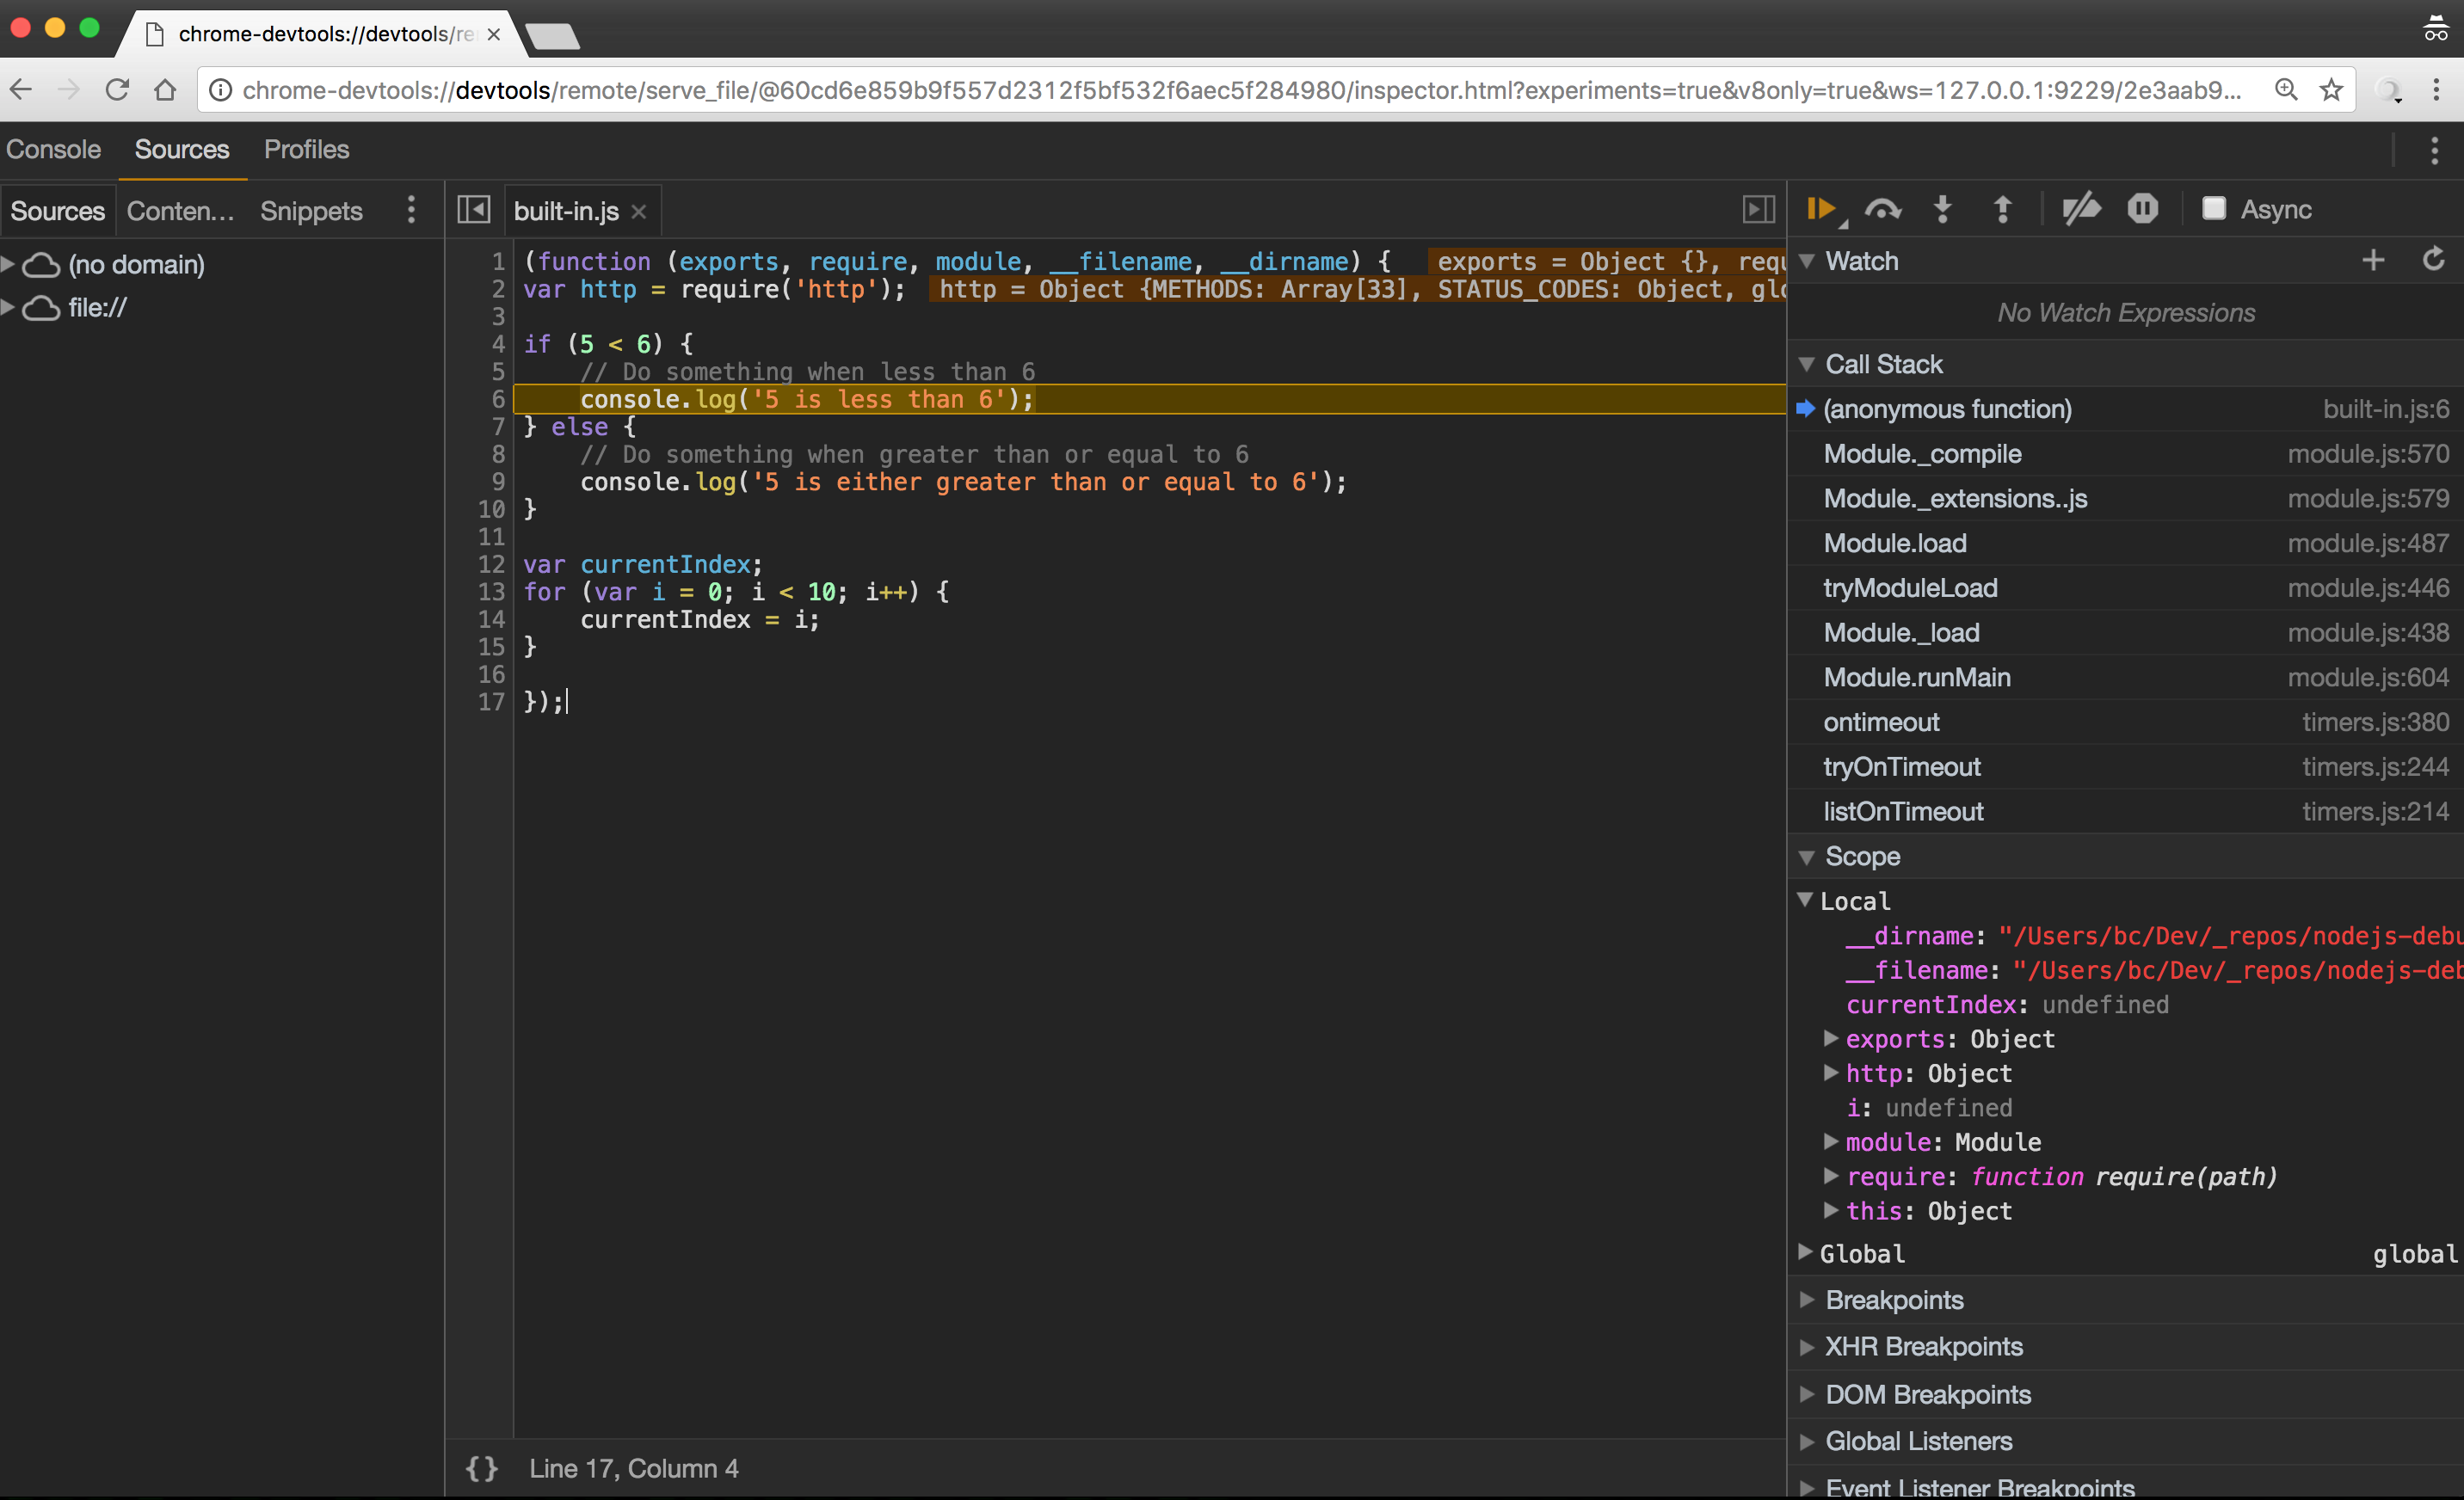
Insert the built-in Node.js inspector that is available as of version 6.3.0. It provides a means to debug Node.js applications with a UI and a familiar one at that. This utility leverages the Chrome developer tools to create an even better debugging experience. It’s filled with the expected features many of us are used to when debugging client-side JavaScript code: view source files, set breakpoints, add watchers and more which can be found in Paul Irish’s post.
In short, we can start the inspector using the --inspect flag and add the --debug-brk option so that it breaks on the first line of code. We will then see a long URL in our terminal which we can copy and paste into a new browser tab.
Visual Studio Code (VS Code)
Up until now we’ve had to do a lot of switching back and forth between a few windows as part of our workflow. Having the ability to stay within one window is something that will definitely speed up the efficiency of our debugging process and VS Code does an excellent job of accomplishing this. Much of its features around debugging are well described and outlined in its corresponding documentation, but let’s highlight a few here that match what we’ve been working through in the previous tools.
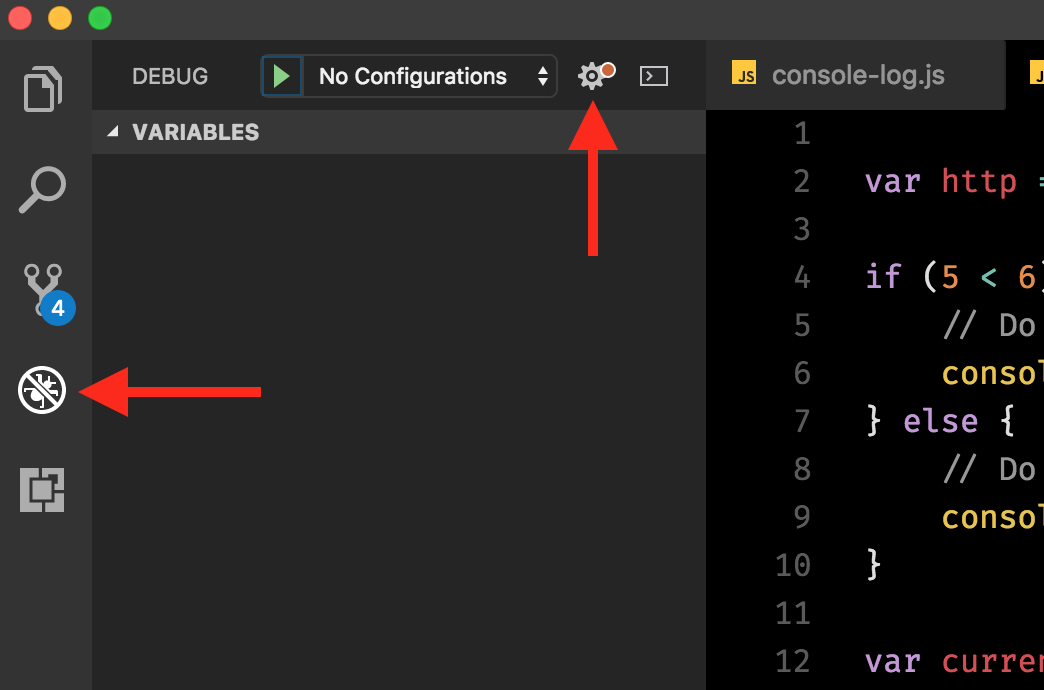
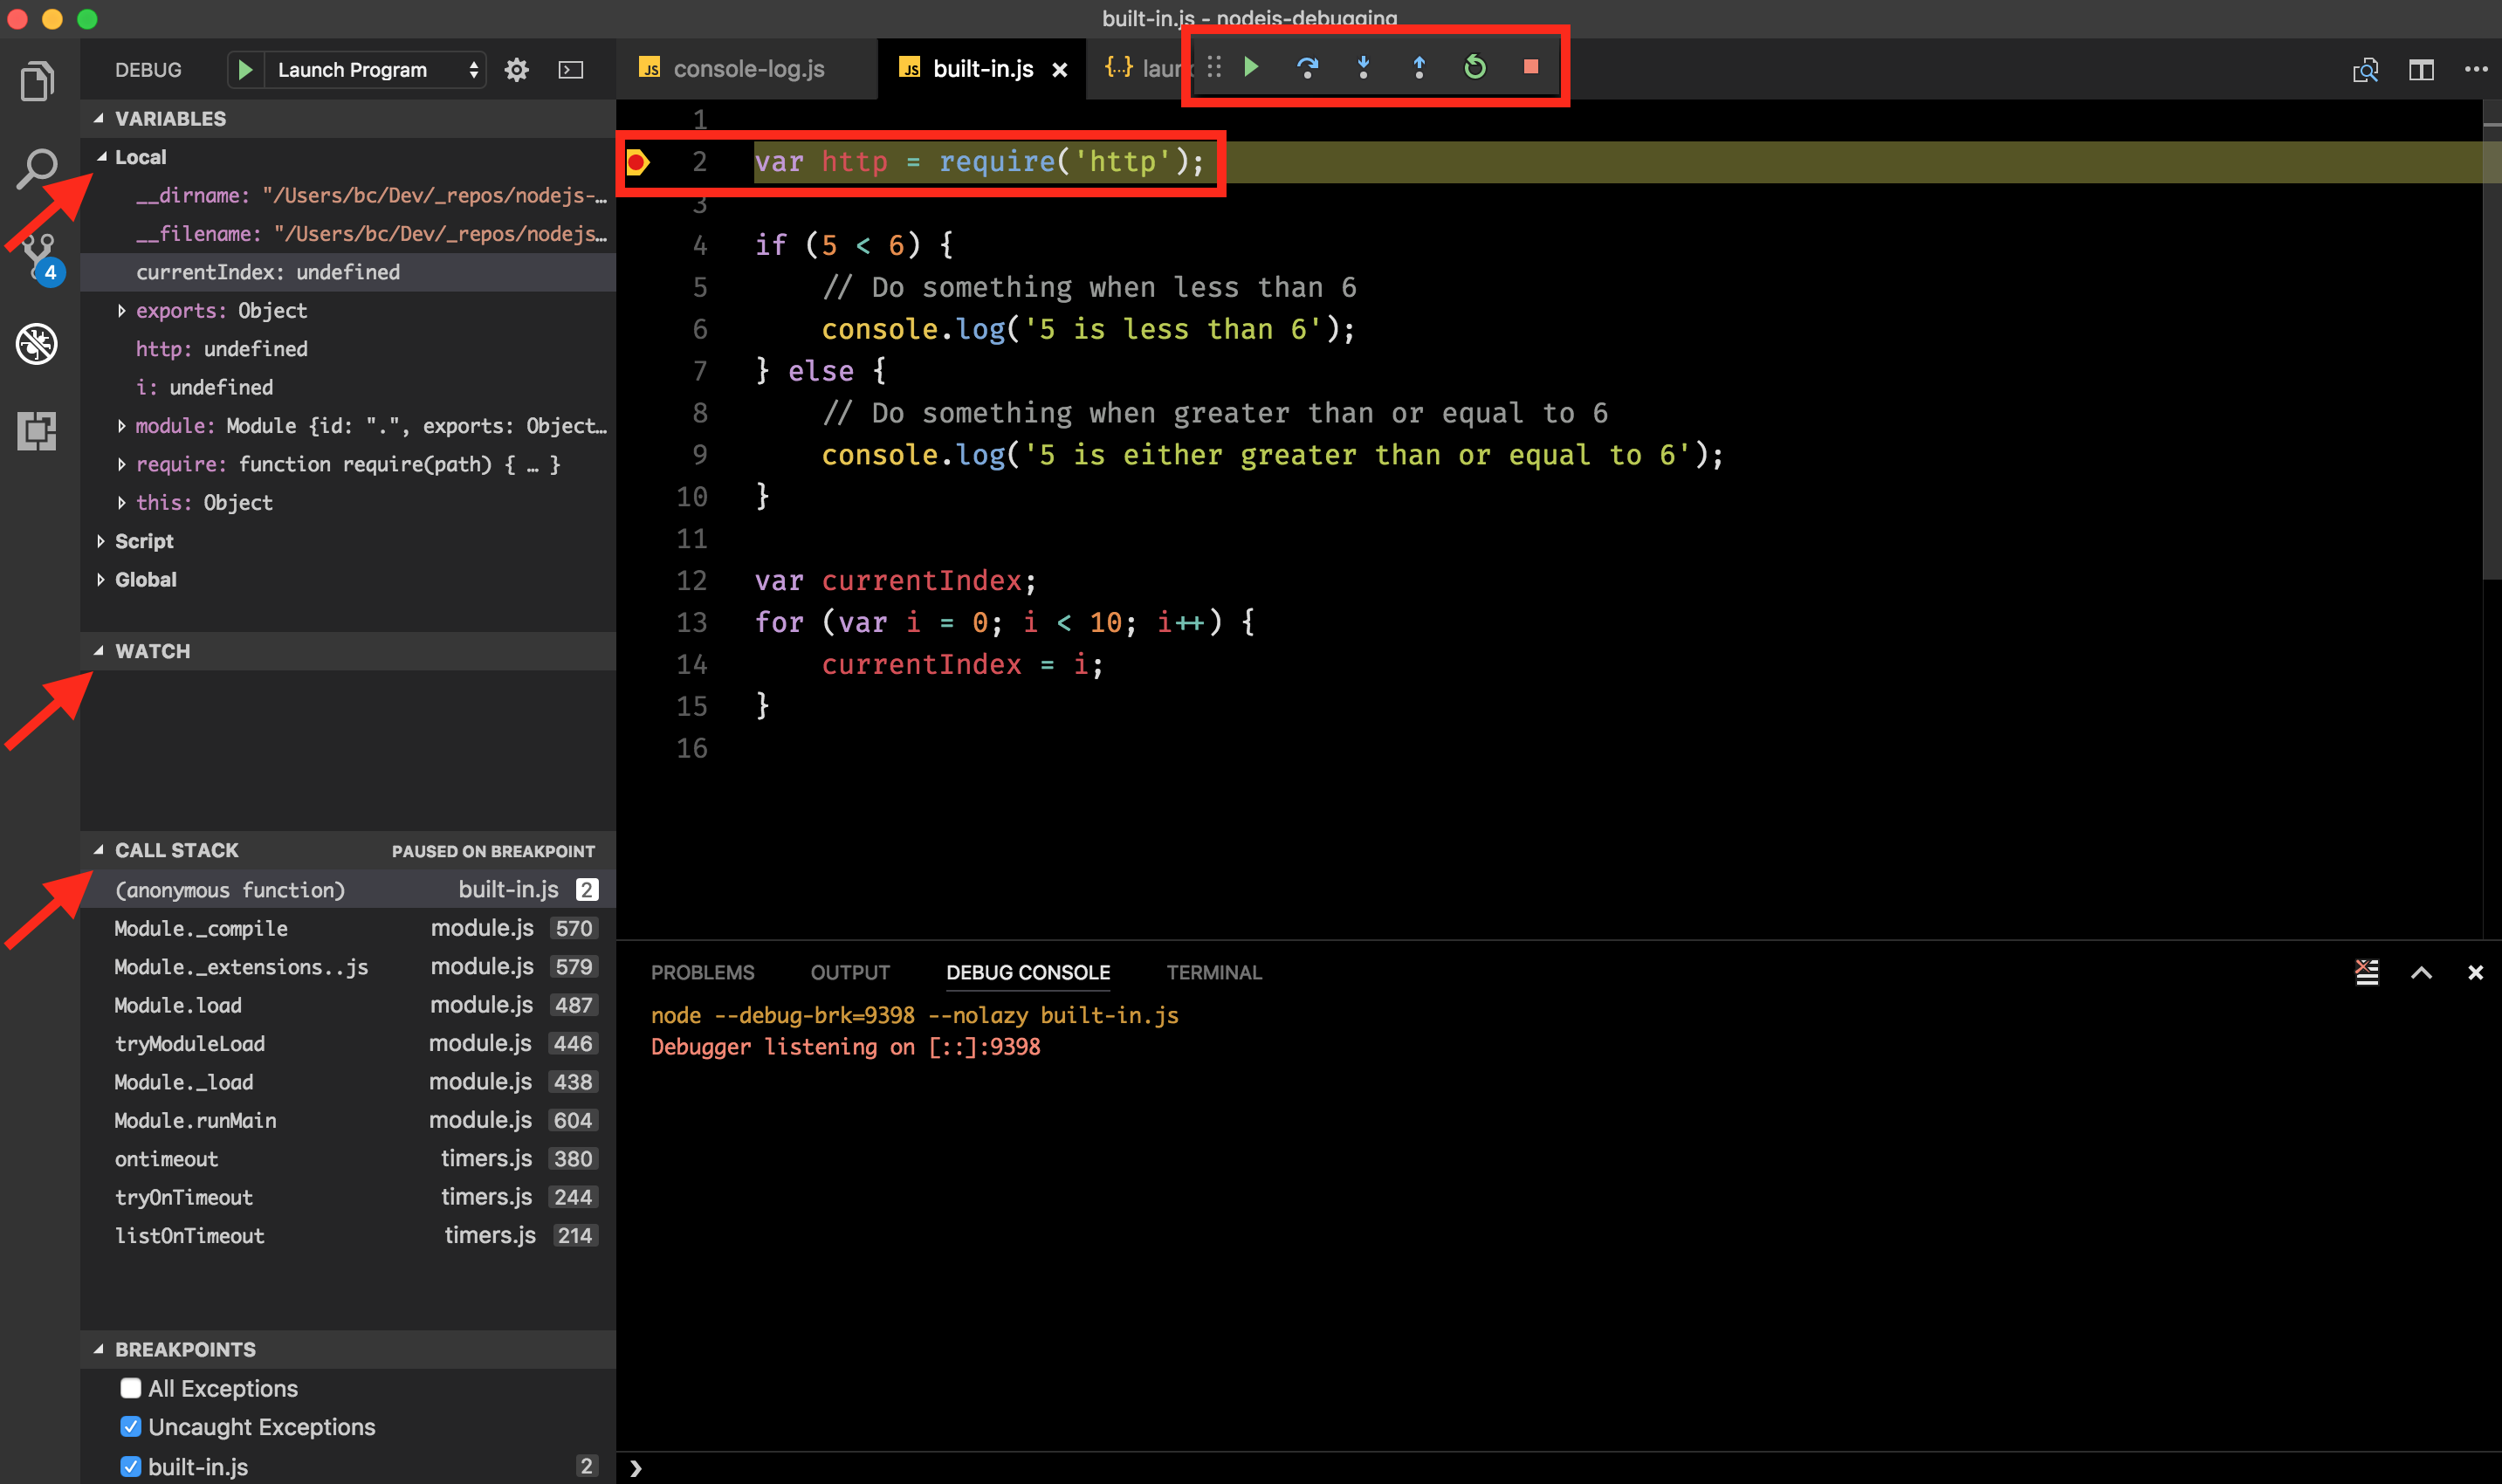
First we’ll need to set up some configuration to tell VS Code we’re going to run and debug a Node.js app. VS Code has a debug view that is visible when we click on the debug icon and then it even provides a starting point for the configuration file we need. We can see this file by clicking the gear icon.
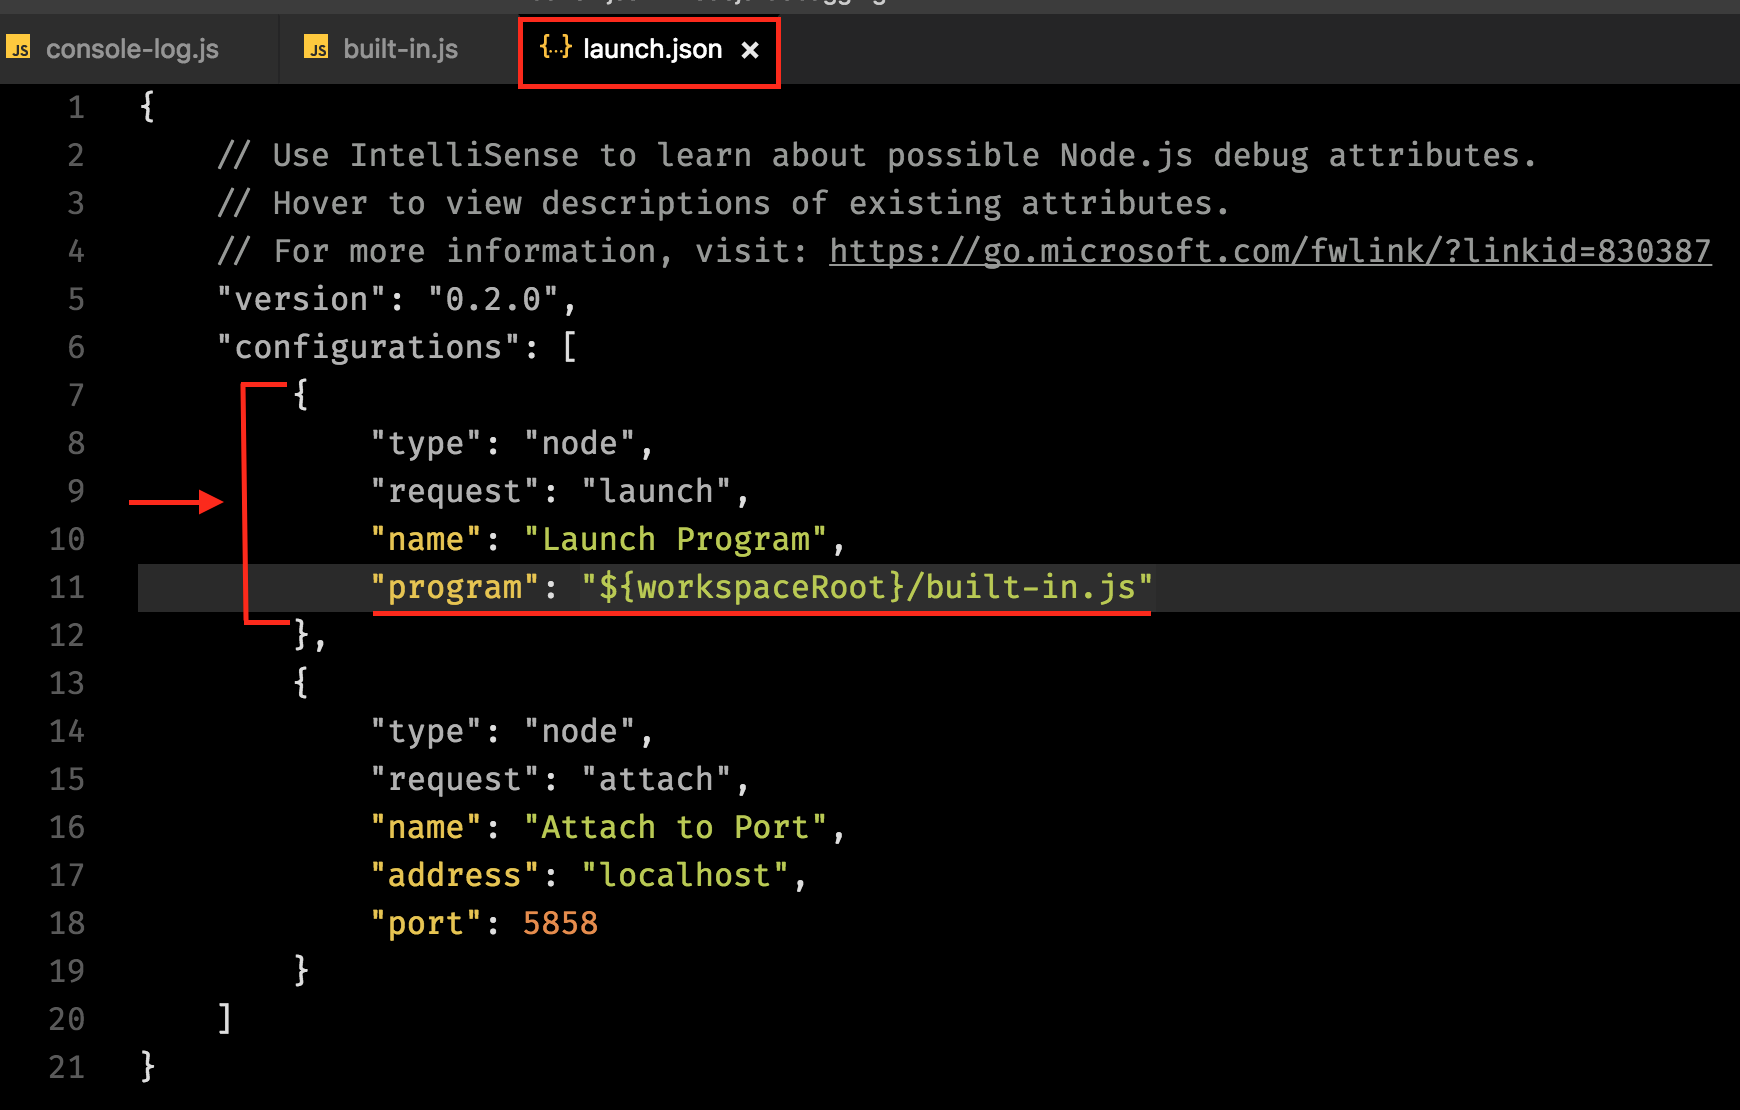
After clicking the gear icon for the first time VS Code will generate and open a launch.json file to help us get started. Within this file we can see two launch configurations for Node.js which VS Code intelligently determined is our type of application. Let’s focus on the Launch Program configuration and hover our mouse over the program option. Once we do that we’ll see a tooltip that describes for what this configuration key is used. In short, this lets VS Code know what file to run at startup. Let’s change the value from ${file} to ${workspaceRoot}/built-in.js so that we can run our code from earlier.
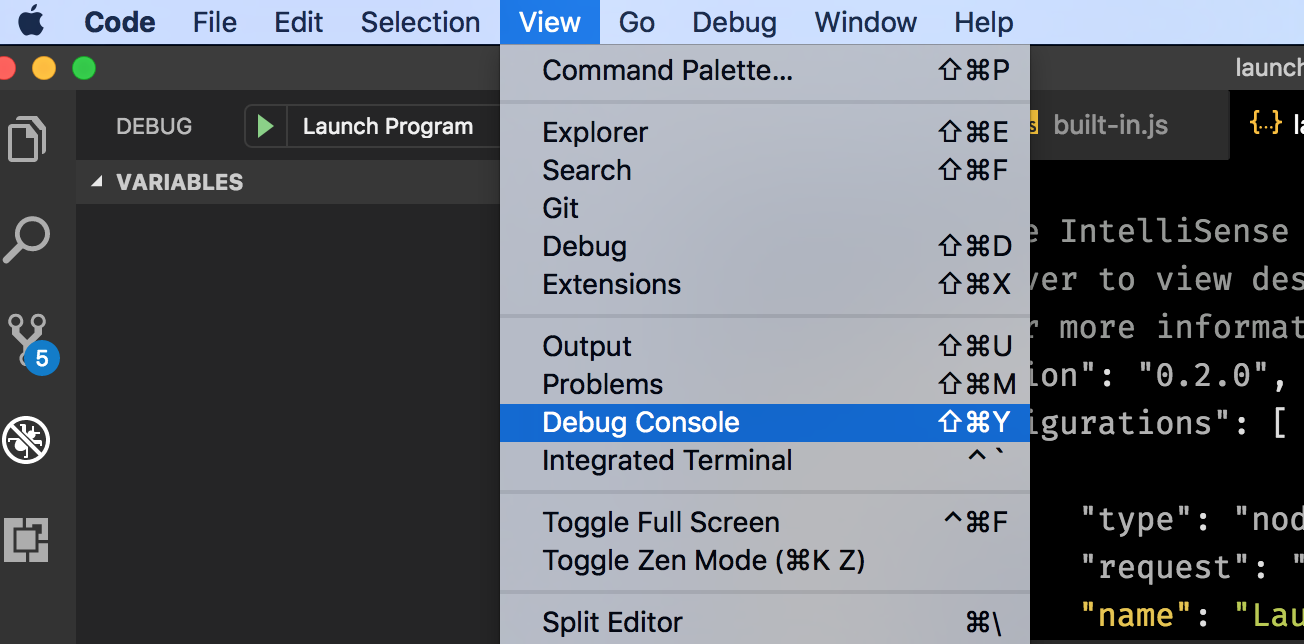
Once that is changed we are ready to run and debug our code. To start our app we can click the green play/arrow button or press F5 on our keyboard. After we do this VS Code will launch our application and pop open the Debug Console. If it doesn’t automatically show the console you can manually do this by pressing CMD + Shift + Y on a Mac or selecting to display it via the View menu option.
At this point everything started, ran and executed already which we can tell from the message logged in the Debug Console: “5 is less than 6”. In order to start stepping through our code we need to open up our code file and set a breakpoint. We can set a breakpoint by clicking next to the line of code at which we want to place one. You’ll see a little circle indicating one was set properly (this will be an unfilled circle because the process is currently running). Then we can restart the app using the navigation buttons found in the small pane that displays at the top of the window.
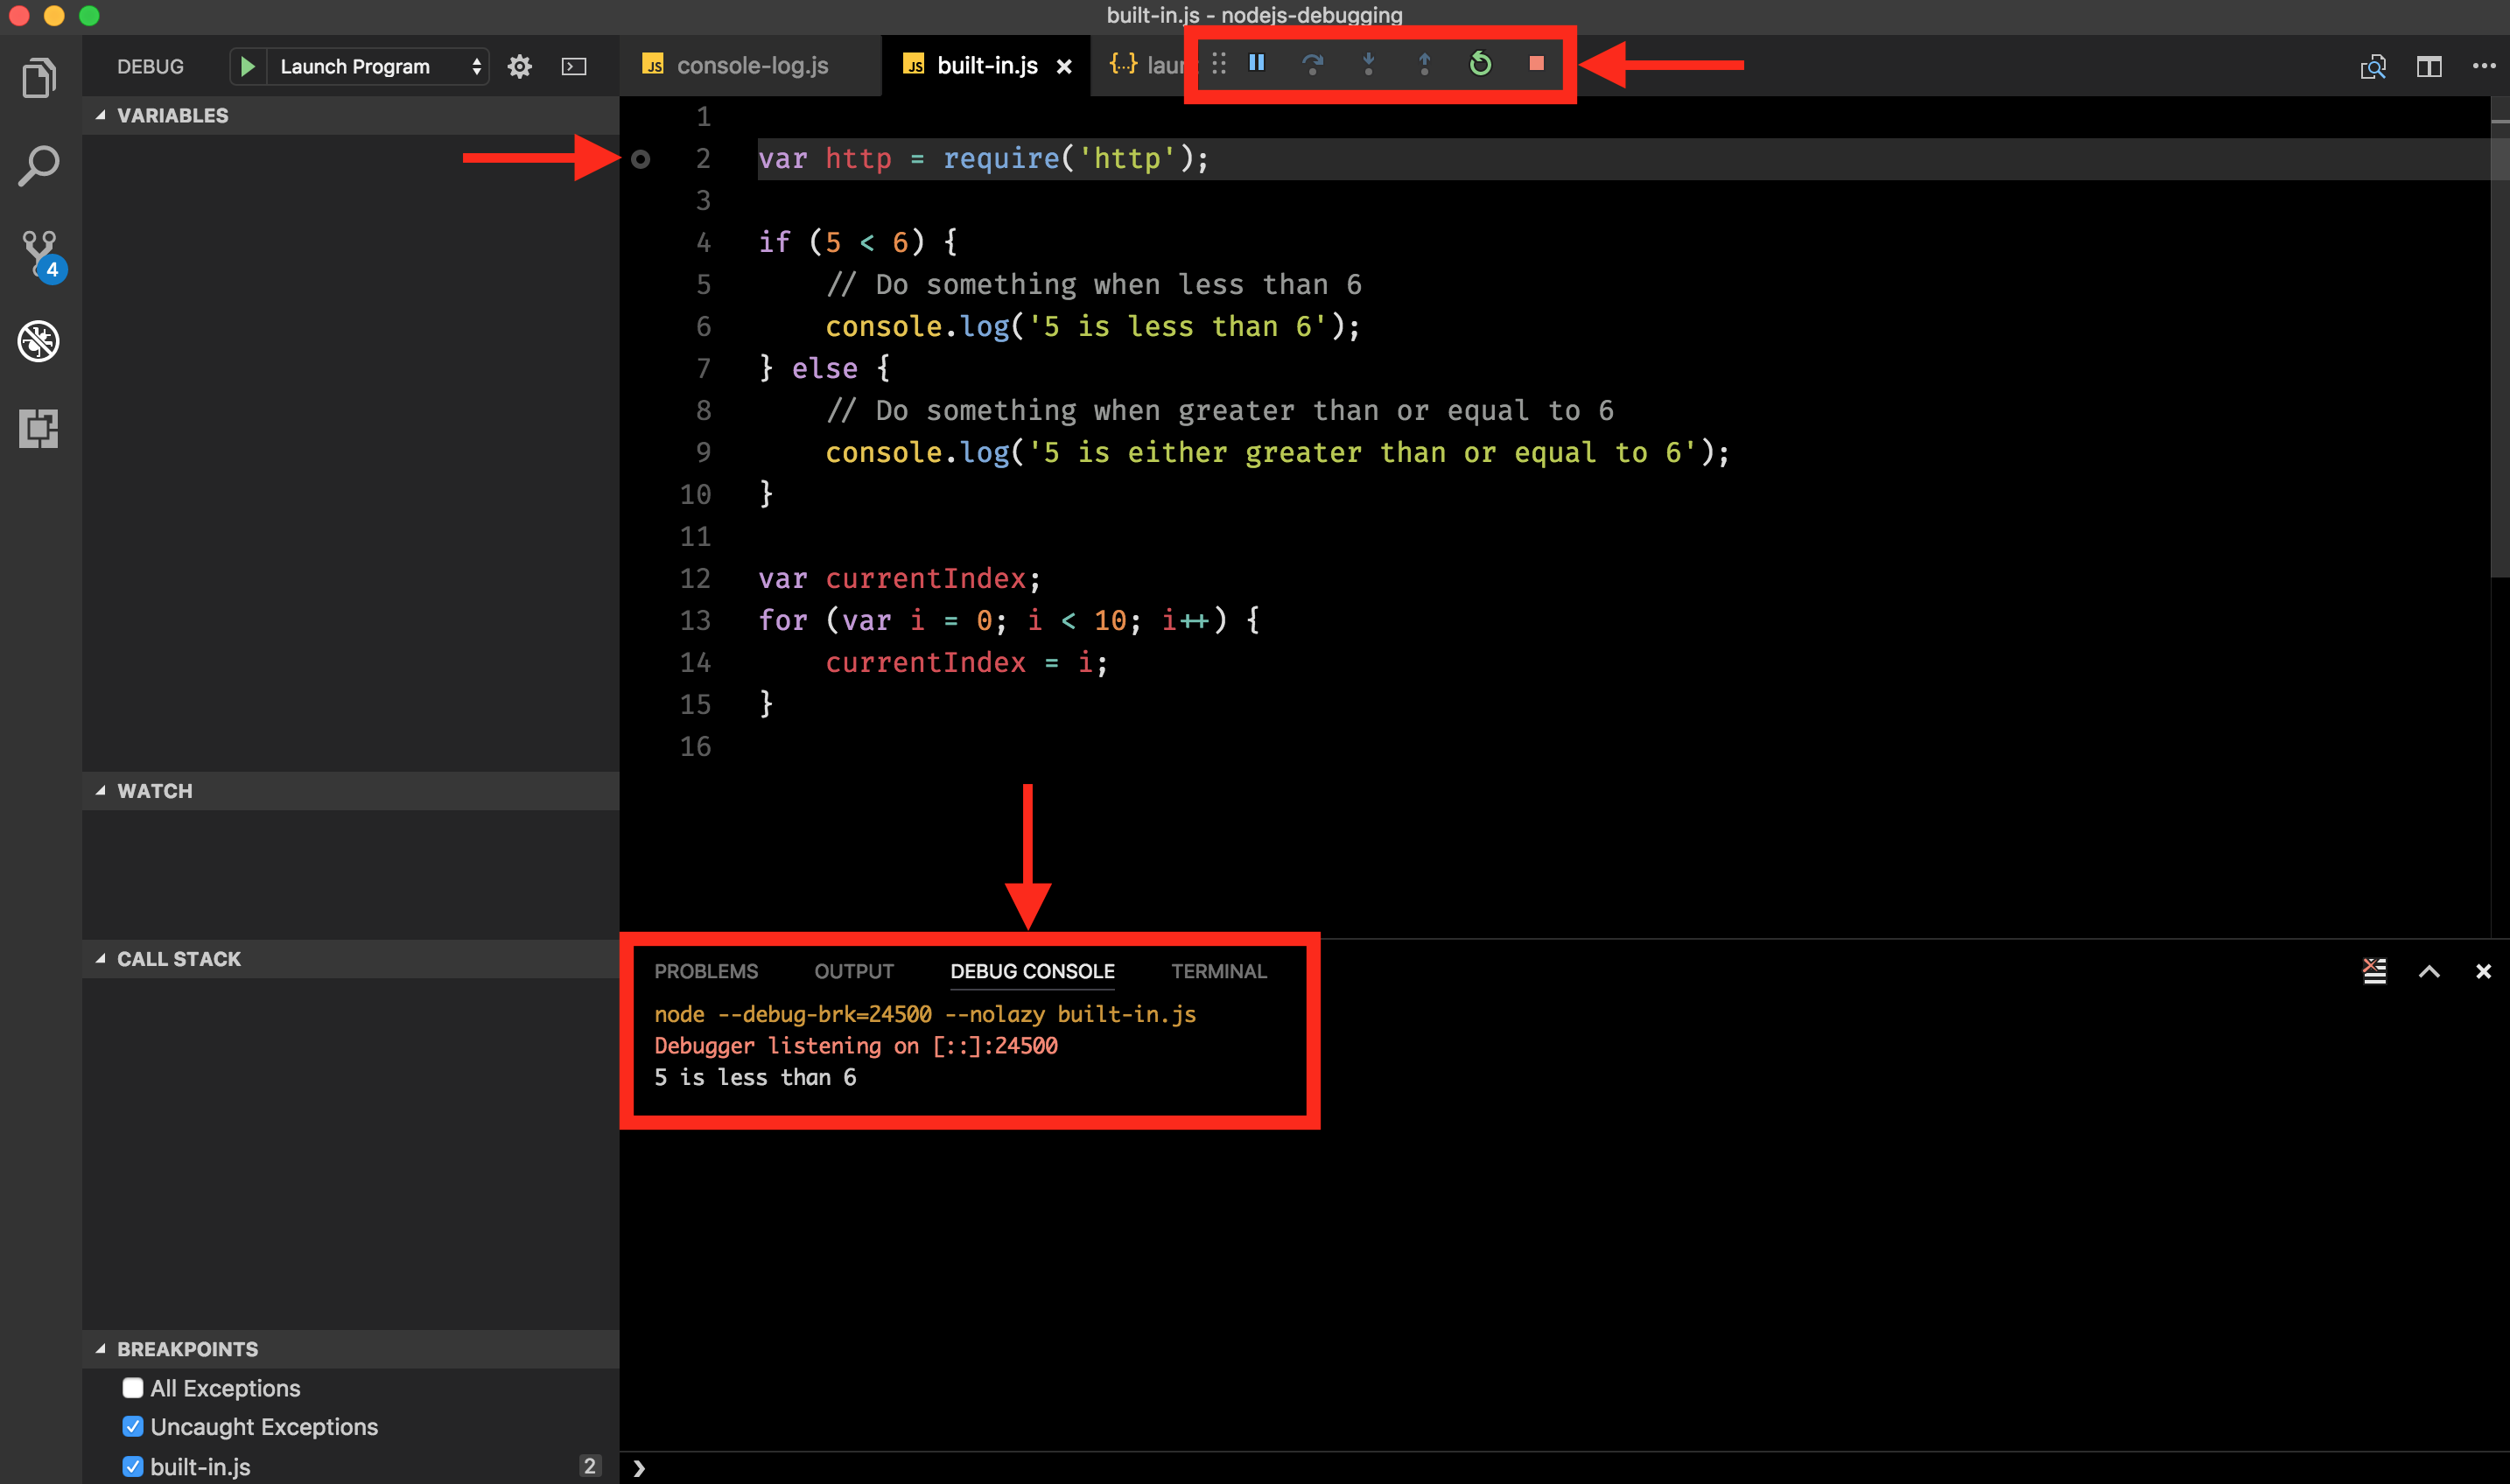
VS Code will then restart our application and we will see that the process breaks on the first breakpoint we set before. We now have many options for how we’d like to proceed. If we want to navigate further through our code we can leverage the various navigation options in the pane described earlier. We can see all Local variables found in the current context of the application. When we want to pin a variable to watch regardless of context we can add it to the Watch items in the left-hand pane. The Call Stack is readily available within that same left-hand pane and continuously updates when we step deeper into our code.
We can find more details on the various features VS code provides through its official documentation, but this should be a great primer for us to realize the value it offers. There are definitely many more possibilities with this great editor and below are a few of them which are worth reading more about (click to view):
Debugging Progression
Since Node.js has been around, the majority of developers have gone through a progression in how they approach debugging their applications. As we have covered, the most simple way to approach this when first starting out is to use the console.log method. The folks over at RisingStack surveyed members of the community how they go about debugging their applications and found that the majority of them use this as well.
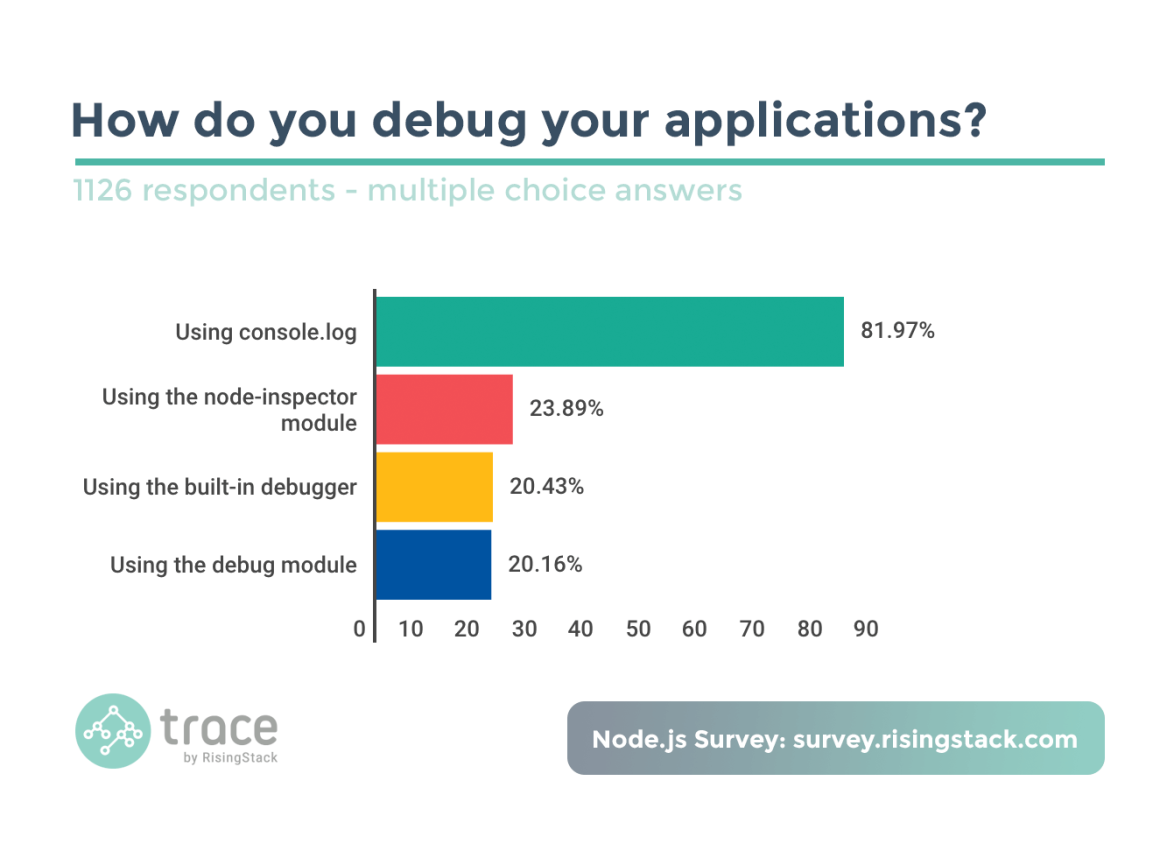 RisingStack: How Developers use Node.js - Survey Results
Another interesting result captured from their survey is that regardless of a developer’s years of experience using Node.js, the majority of them use console.log. This leads us to believe that once someone starts out using this approach they tend to stick with it for all their work within Node.js based projects.
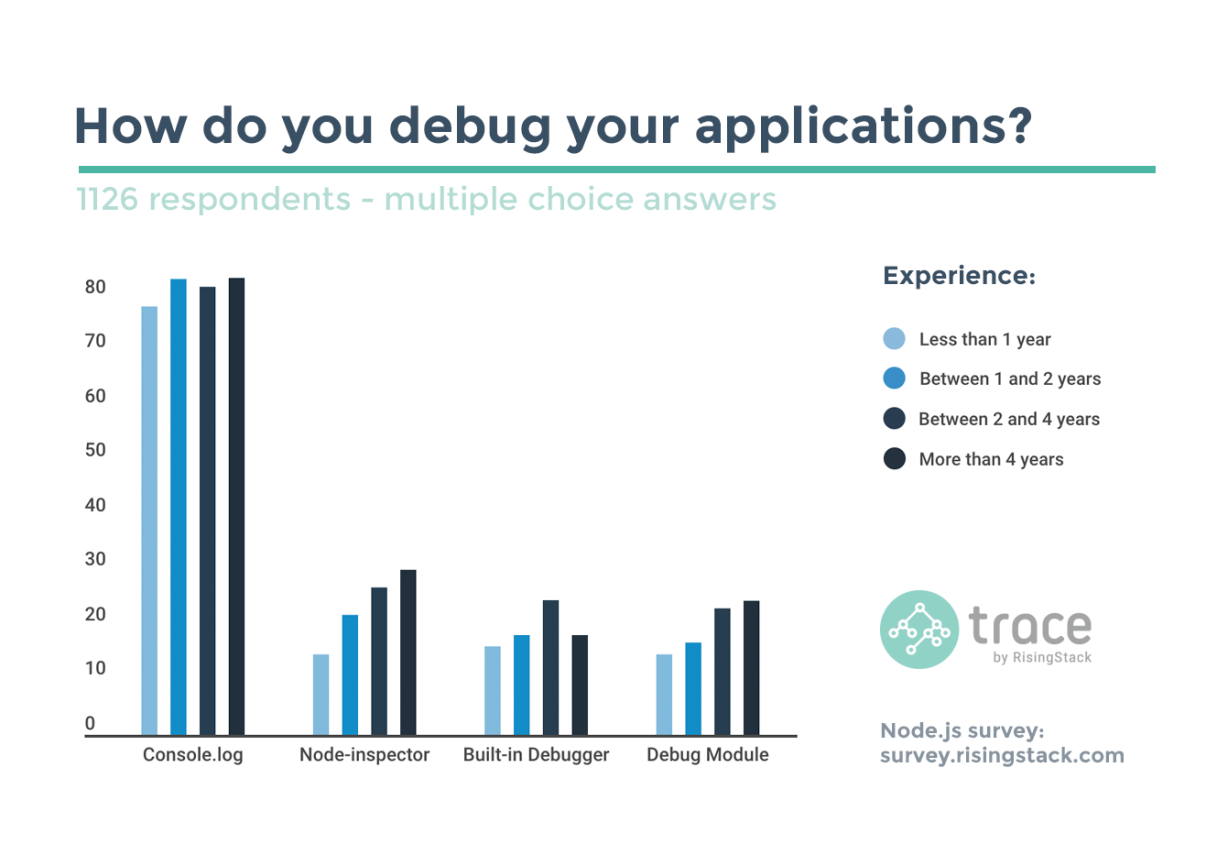 RisingStack: How Developers use Node.js - Survey Results
This is quite unfortunate because as we’ve seen in this post there are options available to us now that make for a much richer and more efficient debugging experience that developers may be missing out on.
If you haven’t done so already you can use the following GitHub repository to try out everything that was discussed in this blog post: clarkio/nodejs-debugging
git clone [email protected]:clarkio/nodejs-debugging.git
cd nodejs-debugging
node console-log.js
If you’re interested in learning how to improve the security of your Node.js applications check out my course on Pluralsight: Getting Started with Node.js Security with Express and Angular